 Timelapse footage from the RPi NOIR
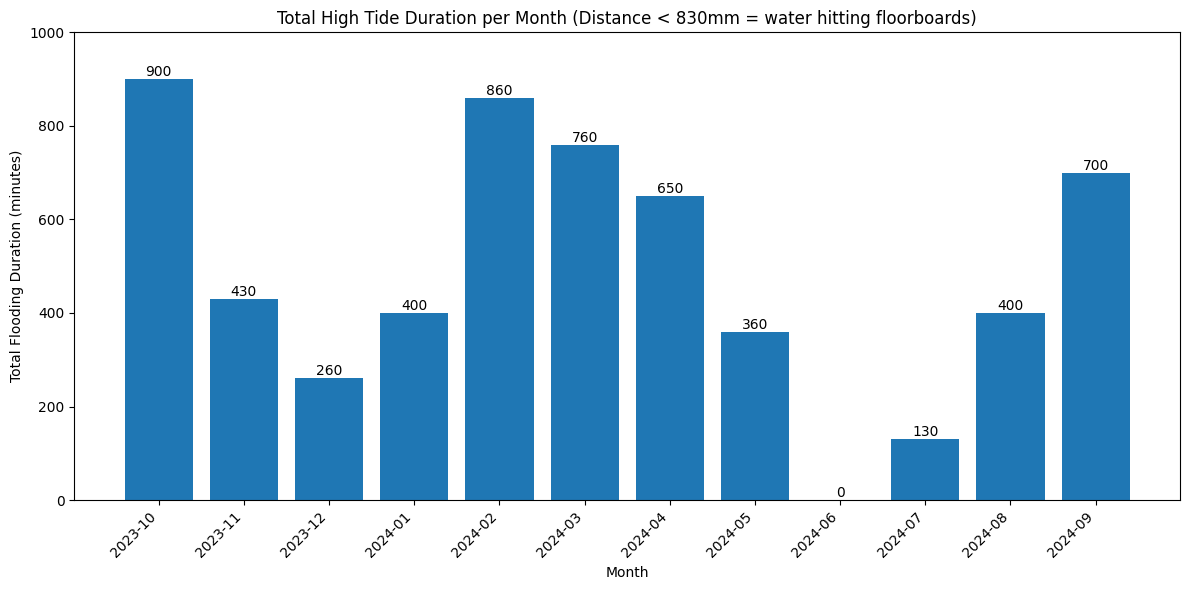
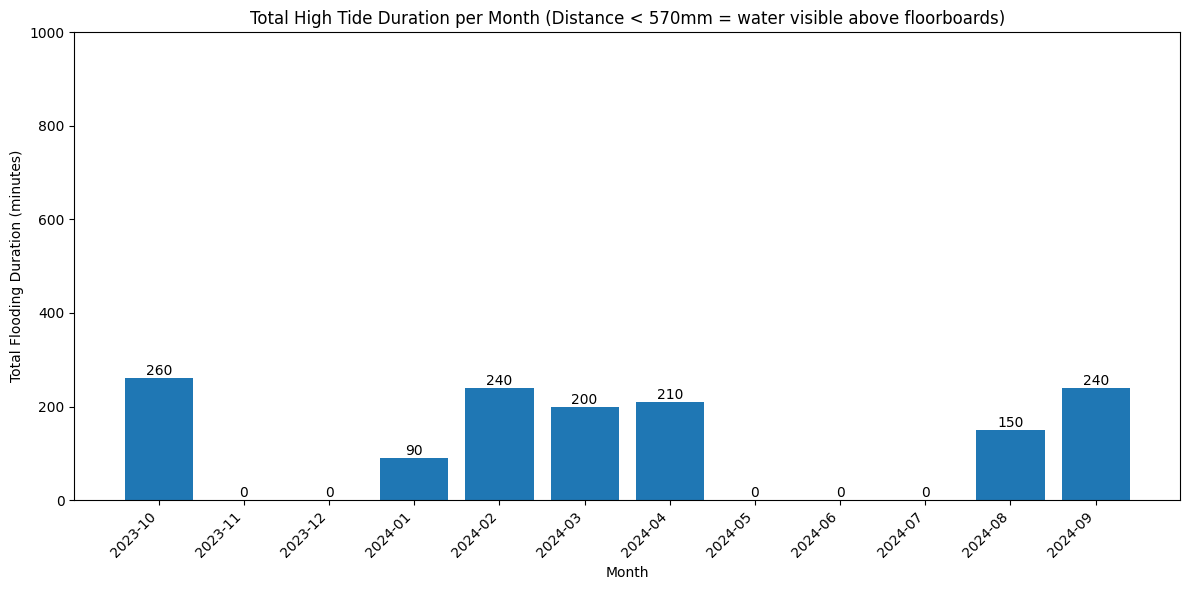
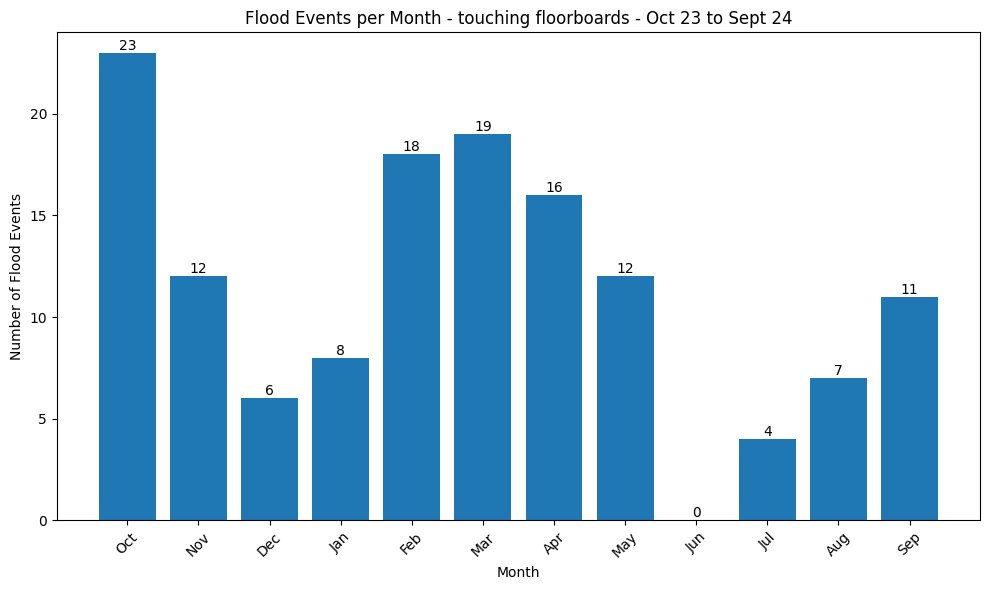
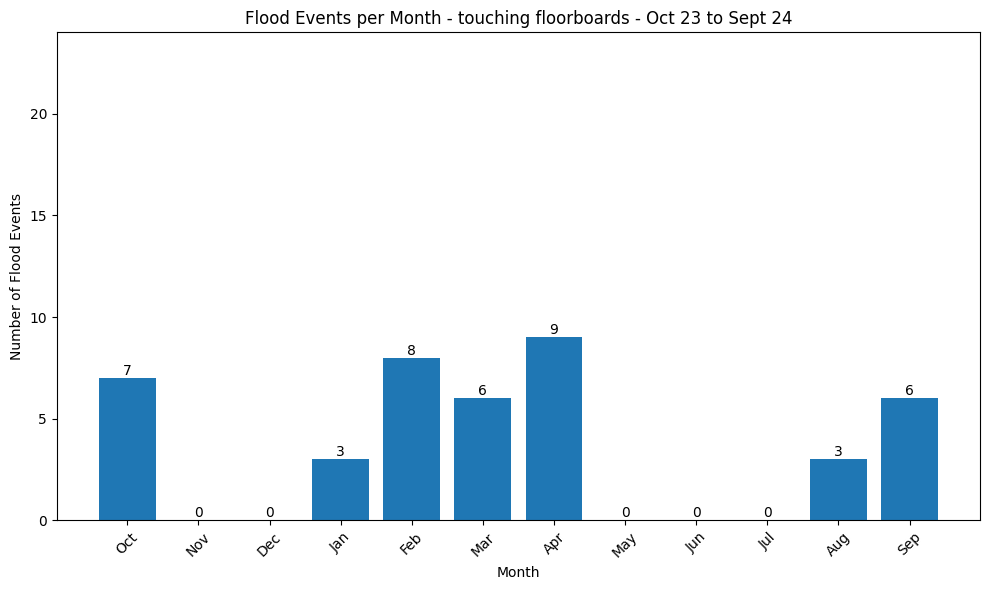
Last week have been pulling together a paper for CUPUM summarising the results of 12 months data from the House Mill analysis. Key observations are that from 136 floods recorded by the IoT system only 42 of those were visible above the floorboards and therefore to the volunteers we have been working with. The abstract of the paper submitted is below.
This paper explores the application of IoT technology to monitor flooding at House Mill, a Grade I listed wooden structure with significant heritage value. Using a water height sensor, flood data was collected every 10 minutes over 12 months. Key metrics, such as hours per month underwater, provided novel insight into flood exposure. The data allowed us to assess flood scale during periods of human absence and quantify the duration of wood submersion, information previously unavailable. 136 floods were recorded by the system, compared to the 42 visible to volunteers maintaining the building.
The GitHub repo has been updated with the analysis and the various scripts used. In addition to the above / below floorboards data I was also curious about the times when the floods occured - it appears that ~45% of floods occured between 8am and 7pm (and therefore likely visible to volunteers).